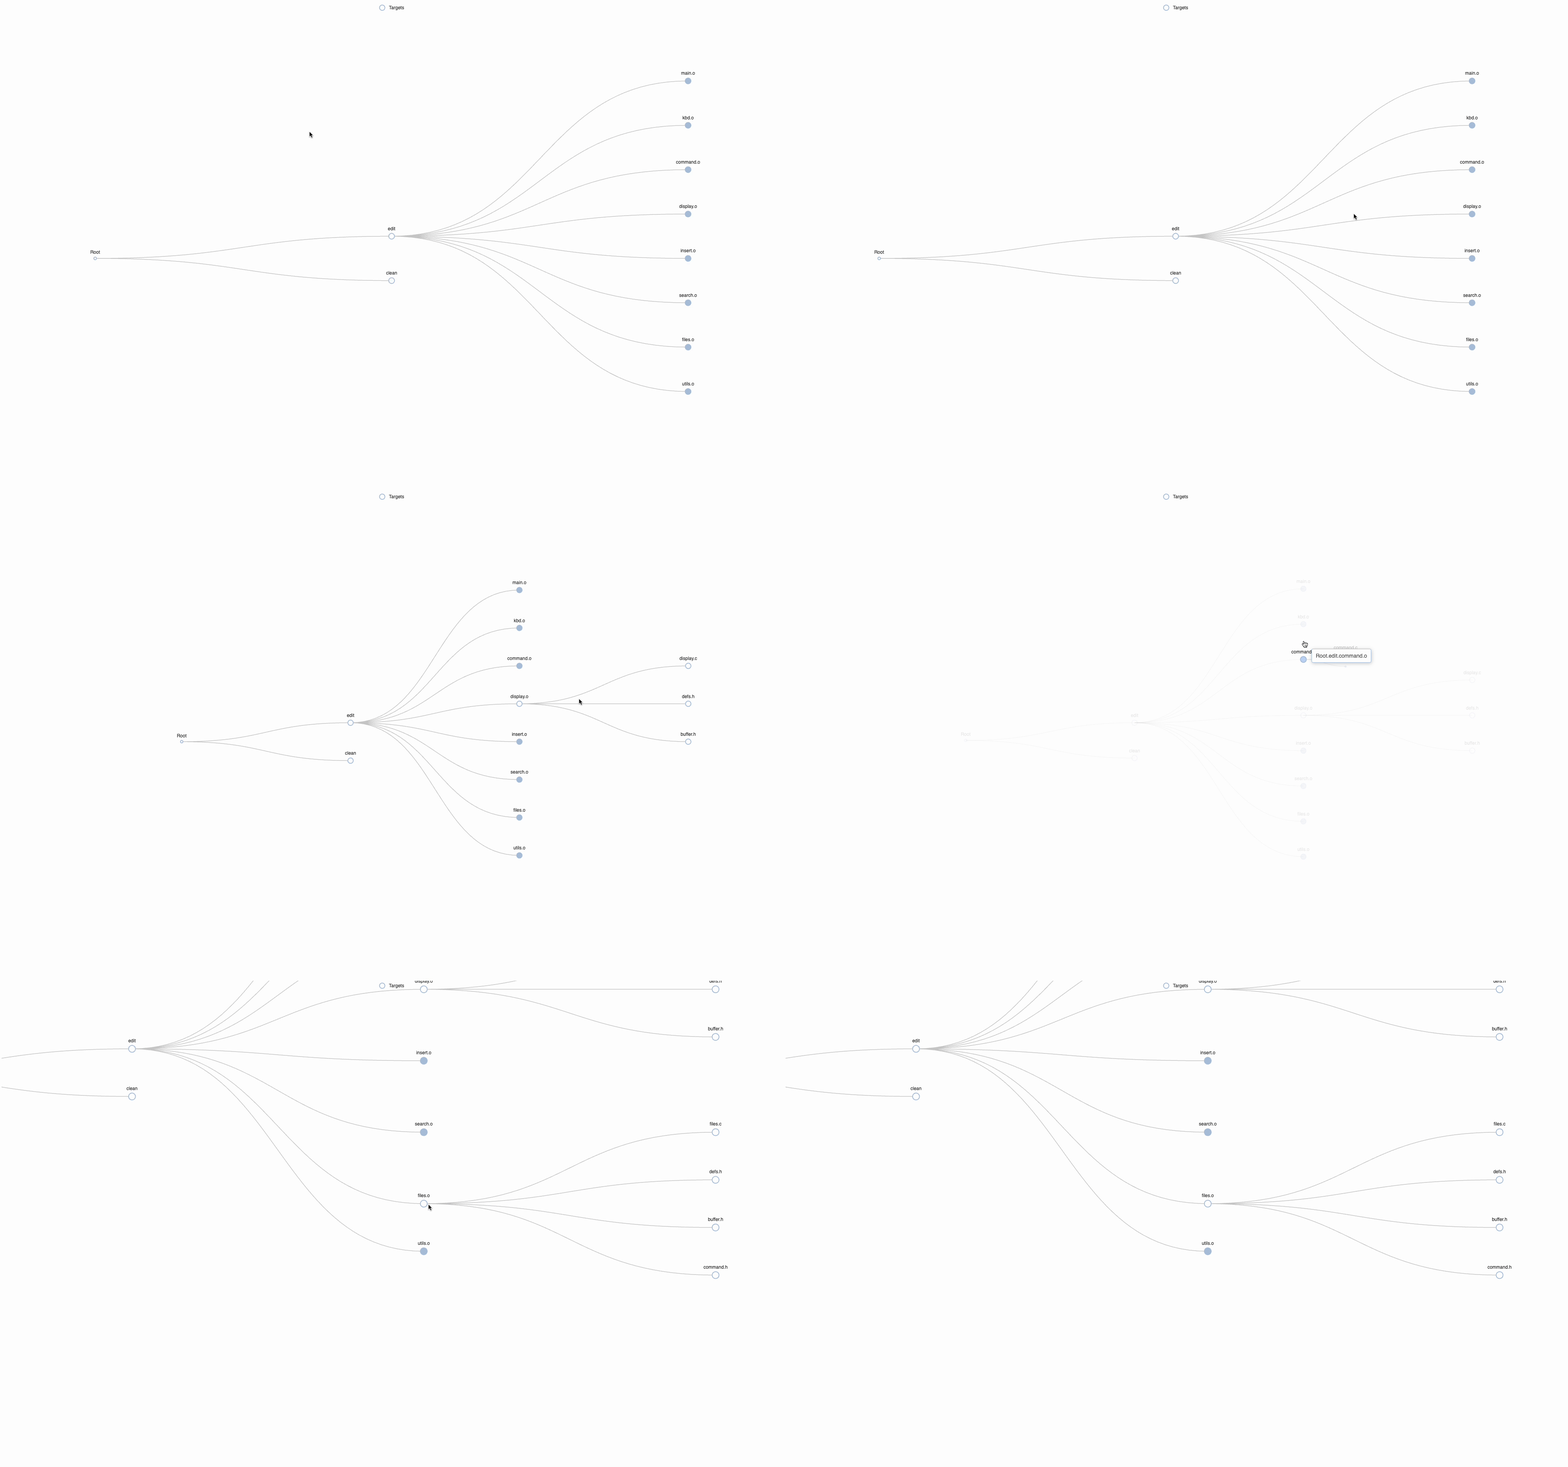
makefile-graph with Apache Echarts support
In a previous post I’ve talked about makefile-graph - a tool which lets you visualize your Makefile targets so you can better understand how targets relate to others.
The makefile-graph tool initially supported two output formats - dot and
tsort. The tsort format prints the topological order after performing a
topological sort of the
graph, and the dot format outputs a representation of the graph in the Dot
language.
Starting with version v0.1.4 of makefile-graph we can now render a graph of
the Makefile targets using Apache
Echarts, which provides a better
interactive experience when inspecting your Makefile targets.
In order to install the latest version of makefile-graph execute the following
command.
go install github.com/dnaeon/makefile-graph/cmd/makefile-graph@latest
In order to render a graph using Apache Echarts we need to specify the --format
echarts option, e.g.
makefile-graph \
--makefile examples/Makefile \
--direction LR \
--format
echarts
The command above will generate an HTML document, which you can save and open.
If you want to use a different theme (e.g. dark, vintage, etc.) you can
specify the Echarts theme using the --theme option. The font size and style
can be controlled via the --font-size and --font-style options
respectively. For example this command will render the graph using the dark
theme of Echarts.
makefile-graph \
    --makefile examples/Makefile \
    --direction LR \
    --theme dark \
    --format echarts
For additional information and examples, please refer to the dnaeon/makefile-graph repo.

