
Exploring COVID-19 data in Common Lisp
Considering the current COVID-19 pandemic and the lockdown period in my country, which lasted for a few months, I’ve been thinking about spending some time exploring the data about the virus spread.
For that particular task I’ve used Common Lisp as the programming language to create a system, that can fetch COVID-19 data from remote APIs and persist them locally in a SQLite database, so that the data can be reviewed offline.
You can get the code from the cl-covid19 repo from Github.
In this post I will go over some examples how to fetch data and plot some graphs. For more examples I’d suggest going to the cl-covid19 project page and checking out the additional documentation.
First, lets load the cl-covid19 system.
CL-USER> (ql:quickload :cl-covid19)
COVID-19 data will be stored locally in a SQLite database, so we need to create a database connection.
CL-USER> (defparameter *db-conn*
           (covid19:make-db-conn "covid19.db"))
*DB-CONN*
Next, we need to apply the database migrations, so that the database schema is properly created. Database schema migrations are handled by cl-migratum system.
CL-USER> (covid19:migrate-db *db-conn*)
Once all migrations have been applied we should see the following tables and views in our SQLite database.
| Name | Description |
|---|---|
migration |
Contains the applied database migrations |
country |
Contains the countries fetched from the remote API |
time_series |
Time series for each country and location |
time_series_global |
Aggregated global time series |
time_series_per_country |
Time series data per country |
time_series_per_country_latest |
Latest time series data per country |
In order to populate the database with some data we will create an API client, which can fetch data from the COVID-19 API.
CL-USER> (defparameter *api-client*
           (covid19:make-api-client))
*API-CLIENT*
Populating the database with data is done by using the
COVID19:UPDATE-ALL-DATA function. The time series data from the
remote API endpoint is updated on daily basis, so if you need to have
fresh data every day make sure to update the local database as well.
CL-USER> (covid19:update-all-data *api-client* *db-conn*)
T
In order to fetch data from the local database you should use the
various COVID19:FETCH-* functions.
For example the following expression will fetch ten countries from the database.
CL-USER> (covid19:fetch-countries *db-conn* :limit 10)
((:|id| 1 :|iso_code| "JE" :|name| "Jersey" :|slug| "jersey")
 (:|id| 2 :|iso_code| "MM" :|name| "Myanmar" :|slug| "myanmar")
 (:|id| 3 :|iso_code| "NA" :|name| "Namibia" :|slug| "namibia")
 (:|id| 4 :|iso_code| "SO" :|name| "Somalia" :|slug| "somalia")
 (:|id| 5 :|iso_code| "AU" :|name| "Australia" :|slug| "australia")
 (:|id| 6 :|iso_code| "GD" :|name| "Grenada" :|slug| "grenada")
 (:|id| 7 :|iso_code| "JP" :|name| "Japan" :|slug| "japan")
 (:|id| 8 :|iso_code| "QA" :|name| "Qatar" :|slug| "qatar")
 (:|id| 9 :|iso_code| "UM" :|name| "US Minor Outlying Islands" :|slug|
  "us-minor-outlying-islands")
 (:|id| 10 :|iso_code| "AG" :|name| "Antigua and Barbuda" :|slug|
  "antigua-and-barbuda"))
If you want to display these results in a nice table format you can
also use the COVID19:DISPLAY-TABLE function, e.g.
CL-USER> (covid19:display-table
          (covid19:fetch-countries *db-conn* :limit 10))
+----+----------+---------------------------+---------------------------+
| id | iso_code | name                      | slug                      |
+----+----------+---------------------------+---------------------------+
|  1 | JE       | Jersey                    | jersey                    |
|  2 | MM       | Myanmar                   | myanmar                   |
|  3 | NA       | Namibia                   | namibia                   |
|  4 | SO       | Somalia                   | somalia                   |
|  5 | AU       | Australia                 | australia                 |
|  6 | GD       | Grenada                   | grenada                   |
|  7 | JP       | Japan                     | japan                     |
|  8 | QA       | Qatar                     | qatar                     |
|  9 | UM       | US Minor Outlying Islands | us-minor-outlying-islands |
| 10 | AG       | Antigua and Barbuda       | antigua-and-barbuda       |
+----+----------+---------------------------+---------------------------+
NIL
The following example uses the COVID19:FETCH-TIME-SERIES-FOR-COUNTRY function
in order to get the data for a given country for the past 10 days.
CL-USER> (covid19:display-table
          (covid19:fetch-time-series-for-country *db-conn* "Bulgaria" :limit 10))
+----------------------+-----------+--------+-----------+--------+---------------+------------+---------------+------------+------------+--------------+--------------+------------------+
| timestamp            | confirmed | deaths | recovered | active | new_confirmed | new_deaths | new_recovered | new_active | country_id | country_name | country_slug | country_iso_code |
+----------------------+-----------+--------+-----------+--------+---------------+------------+---------------+------------+------------+--------------+--------------+------------------+
| 2020-06-16T00:00:00Z |      3453 |    181 |      1817 |   1455 |           112 |          5 |            33 |         74 |         44 | Bulgaria     | bulgaria     | BG               |
| 2020-06-15T00:00:00Z |      3341 |    176 |      1784 |   1381 |            51 |          2 |            54 |         -5 |         44 | Bulgaria     | bulgaria     | BG               |
| 2020-06-14T00:00:00Z |      3290 |    174 |      1730 |   1386 |            24 |          2 |             7 |         15 |         44 | Bulgaria     | bulgaria     | BG               |
| 2020-06-13T00:00:00Z |      3266 |    172 |      1723 |   1371 |            75 |          0 |             7 |         68 |         44 | Bulgaria     | bulgaria     | BG               |
| 2020-06-12T00:00:00Z |      3191 |    172 |      1716 |   1303 |           105 |          4 |            28 |         73 |         44 | Bulgaria     | bulgaria     | BG               |
| 2020-06-11T00:00:00Z |      3086 |    168 |      1688 |   1230 |            93 |          1 |            24 |         68 |         44 | Bulgaria     | bulgaria     | BG               |
| 2020-06-10T00:00:00Z |      2993 |    167 |      1664 |   1162 |           104 |          0 |            41 |         63 |         44 | Bulgaria     | bulgaria     | BG               |
| 2020-06-09T00:00:00Z |      2889 |    167 |      1623 |   1099 |            79 |          3 |            36 |         40 |         44 | Bulgaria     | bulgaria     | BG               |
| 2020-06-08T00:00:00Z |      2810 |    164 |      1587 |   1059 |            83 |          4 |            39 |         40 |         44 | Bulgaria     | bulgaria     | BG               |
| 2020-06-07T00:00:00Z |      2727 |    160 |      1548 |   1019 |            16 |          0 |             3 |         13 |         44 | Bulgaria     | bulgaria     | BG               |
+----------------------+-----------+--------+-----------+--------+---------------+------------+---------------+------------+------------+--------------+--------------+------------------+
NIL
Latest (most recent) time-series data per country can be fetched using
the COVID19:FETCH-TIME-SERIES-LATEST function, e.g.
CL-USER> (covid19:display-table
          (covid19:fetch-time-series-latest *db-conn* :limit 5))
+----------------------+-----------+--------+-----------+--------+---------------+------------+---------------+------------+------------+--------------+--------------+------------------+
| timestamp            | confirmed | deaths | recovered | active | new_confirmed | new_deaths | new_recovered | new_active | country_id | country_name | country_slug | country_iso_code |
+----------------------+-----------+--------+-----------+--------+---------------+------------+---------------+------------+------------+--------------+--------------+------------------+
| 2020-06-16T00:00:00Z |       262 |      6 |       179 |     77 |             0 |          0 |             4 |         -4 |          2 | Myanmar      | myanmar      | MM               |
| 2020-06-16T00:00:00Z |        34 |      0 |        18 |     16 |             2 |          0 |             1 |          1 |          3 | Namibia      | namibia      | NA               |
| 2020-06-16T00:00:00Z |      2658 |     88 |       649 |   1921 |            16 |          0 |            27 |        -11 |          4 | Somalia      | somalia      | SO               |
| 2020-06-16T00:00:00Z |      7370 |    102 |      6861 |    407 |            23 |          0 |             5 |         18 |          5 | Australia    | australia    | AU               |
| 2020-06-16T00:00:00Z |        23 |      0 |        22 |      1 |             0 |          0 |             0 |          0 |          6 | Grenada      | grenada      | GD               |
+----------------------+-----------+--------+-----------+--------+---------------+------------+---------------+------------+------------+--------------+--------------+------------------+
NIL
In order to fetch the top countries by given column you can use the
COVID19:FETCH-TOP-COUNTRIES-BY function. The following example will
display the top 5 countries by confirmed cases.
CL-USER> (mapcar (lambda (item)
                   (getf item :|country_name|))
                 (covid19:fetch-top-countries-by *db-conn* :column :confirmed :limit 5))
("United States of America" "Brazil" "Russian Federation" "India"
 "United Kingdom")
The COVID19:FETCH-TIME-SERIES-GLOBAL function returns the aggregated
time series on a global scale. The following example will display the
stats for the past 10 days.
CL-USER> (covid19:display-table
          (covid19:fetch-time-series-global *db-conn* :limit 10))
+----------------------+-----------+--------+-----------+---------+---------------+---------------+------------+------------+
| timestamp            | confirmed | deaths | recovered | active  | new_confirmed | new_recovered | new_deaths | new_active |
+----------------------+-----------+--------+-----------+---------+---------------+---------------+------------+------------+
| 2020-06-16T00:00:00Z |   8274306 | 451939 |   3954518 | 3867849 |        139803 |         97831 |       6829 |      35143 |
| 2020-06-15T00:00:00Z |   8134503 | 445110 |   3856687 | 3832706 |        133896 |         87626 |       3843 |      42427 |
| 2020-06-14T00:00:00Z |   8000607 | 441267 |   3769061 | 3790279 |        134333 |         71408 |       3365 |      59560 |
| 2020-06-13T00:00:00Z |   7866274 | 437902 |   3697653 | 3730719 |        134598 |         85027 |       4400 |      45171 |
| 2020-06-12T00:00:00Z |   7731676 | 433502 |   3612626 | 3685548 |        118757 |         72581 |       3990 |      42186 |
| 2020-06-11T00:00:00Z |   7612919 | 429512 |   3540045 | 3643362 |        154681 |         85889 |       5290 |      63502 |
| 2020-06-10T00:00:00Z |   7458238 | 424222 |   3454156 | 3579860 |        118483 |         79139 |       4833 |      34511 |
| 2020-06-09T00:00:00Z |   7339755 | 419389 |   3375017 | 3545349 |        124338 |         82260 |       4974 |      37104 |
| 2020-06-08T00:00:00Z |   7215417 | 414415 |   3292757 | 3508245 |        109895 |        152488 |       3825 |     -46418 |
| 2020-06-07T00:00:00Z |   7105522 | 410590 |   3140269 | 3554663 |        118555 |         55087 |       3039 |      60429 |
+----------------------+-----------+--------+-----------+---------+---------------+---------------+------------+------------+
NIL
Another nice feature of the cl-covid19 system is the ability to plot
graphs using gnuplot.
This is how we can plot a graph using the time-series data for a given country.
CL-USER> (covid19:plot-time-series-for-country *db-conn*
                                               "Bulgaria"
                                               :limit 90)
NIL
The graph looks like this.
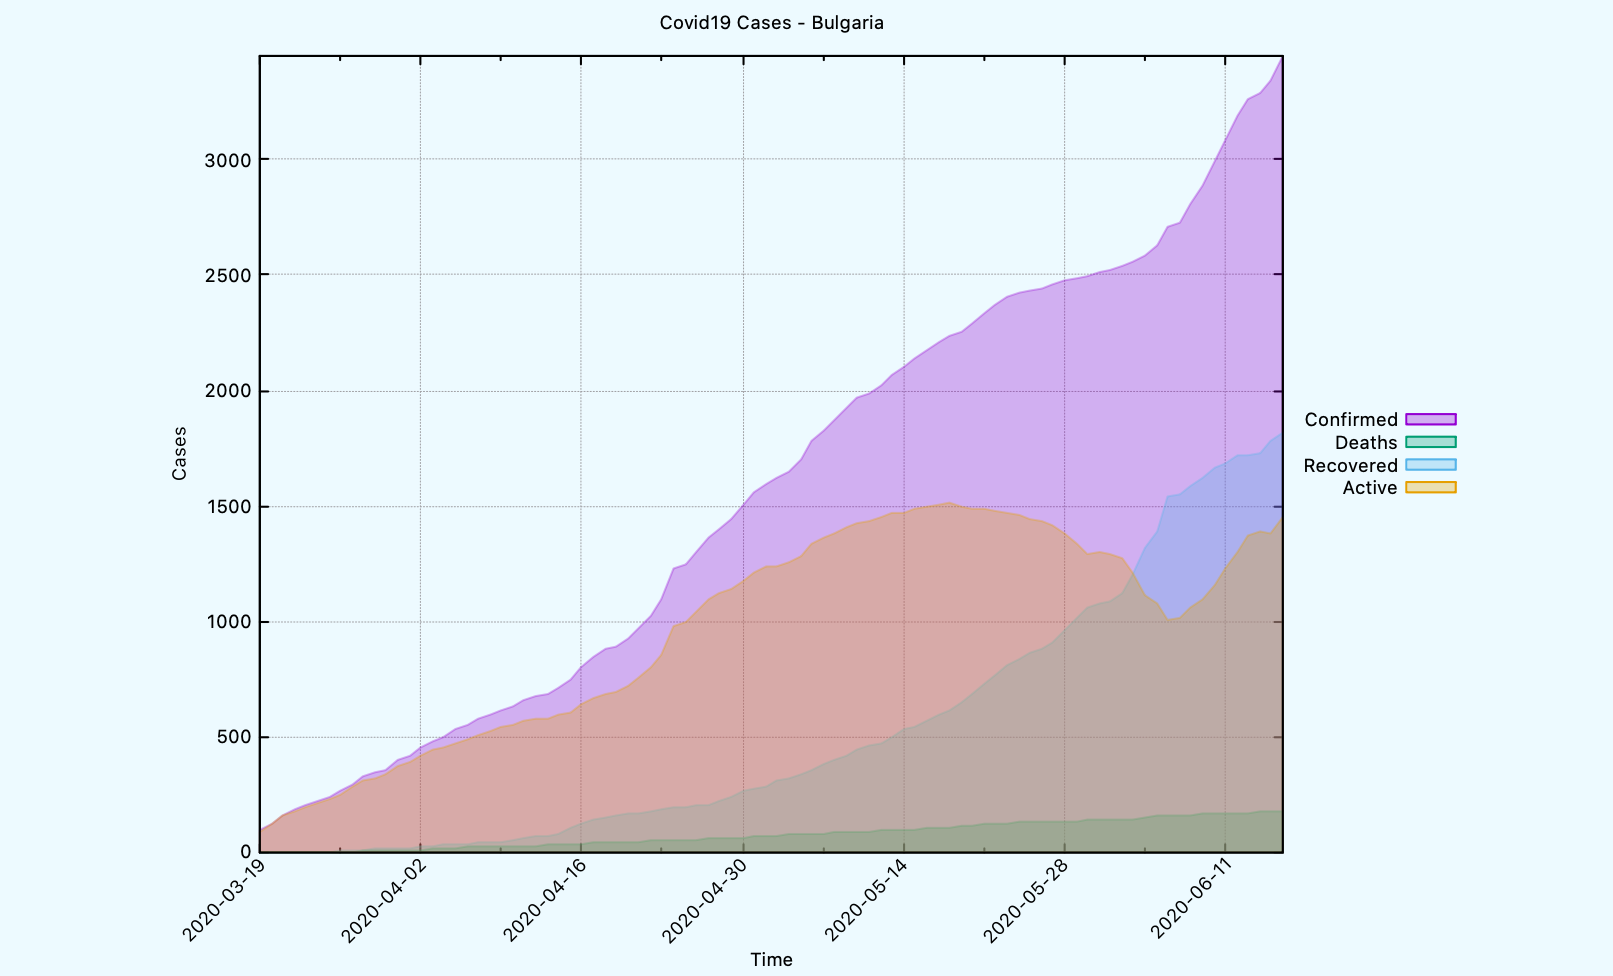
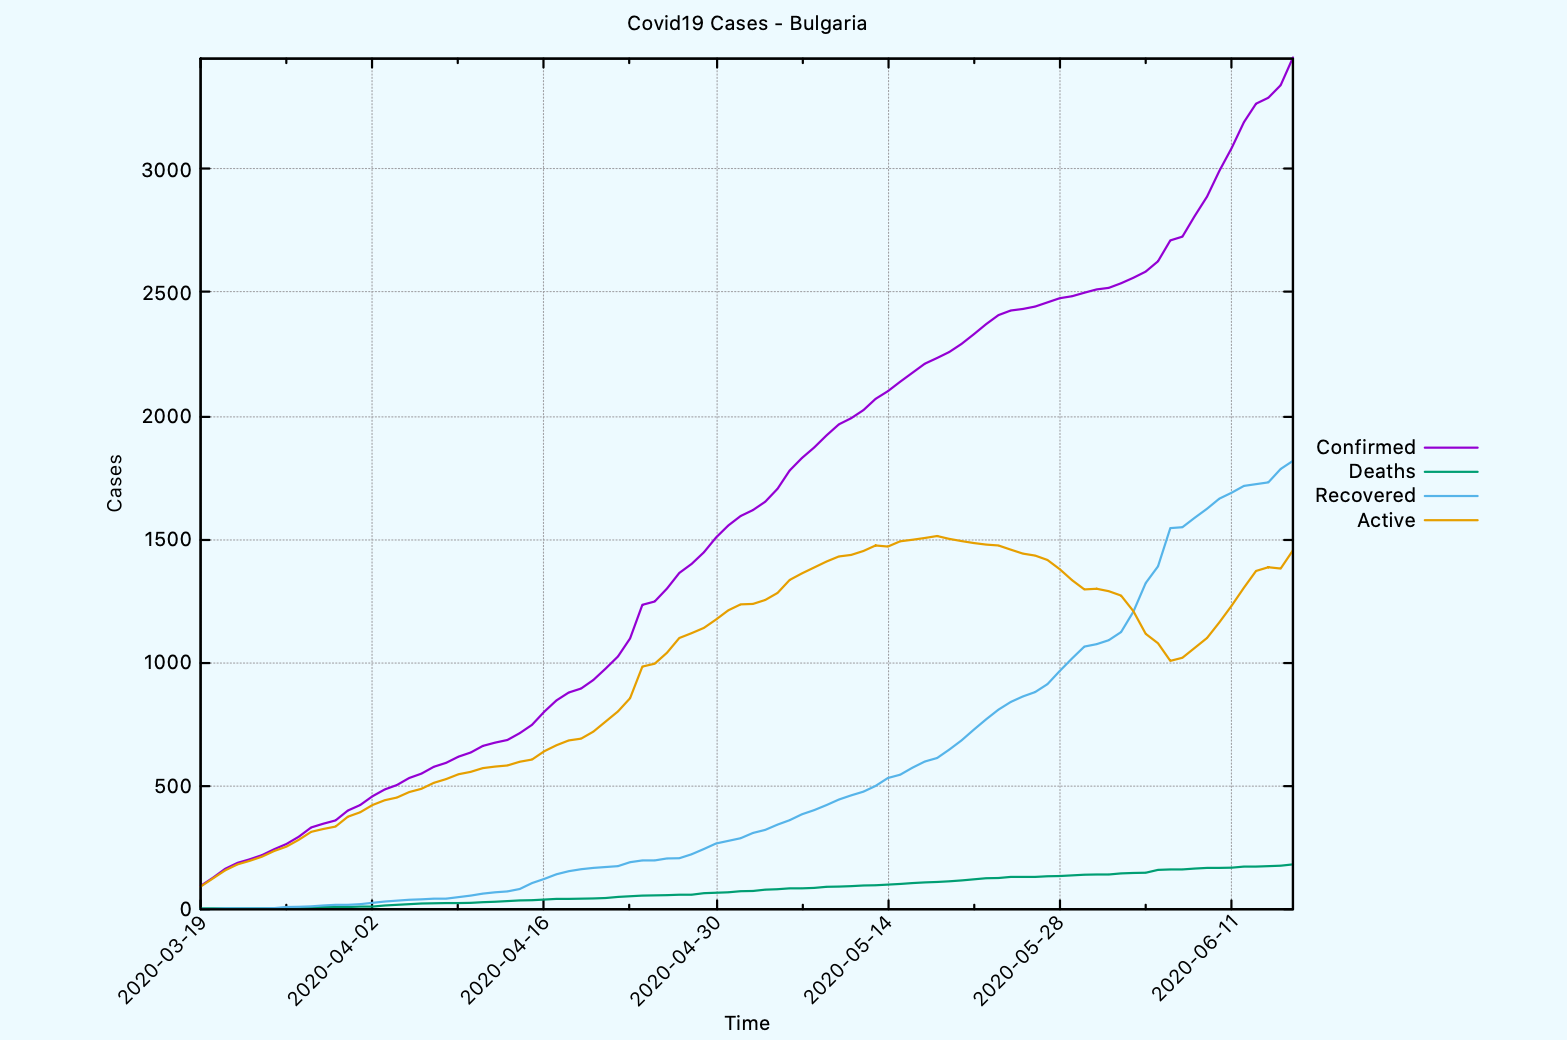
Above graph uses filled curves, but we can plot the graph using a different
template, if needed.
CL-USER> (covid19:plot-time-series-for-country *db-conn*
                                               "Bulgaria"
                                               :limit 90
                                               :template covid19:*gnuplot-time-series-with-lines-template*)
NIL
This is how the graph looks like when we use the different template.
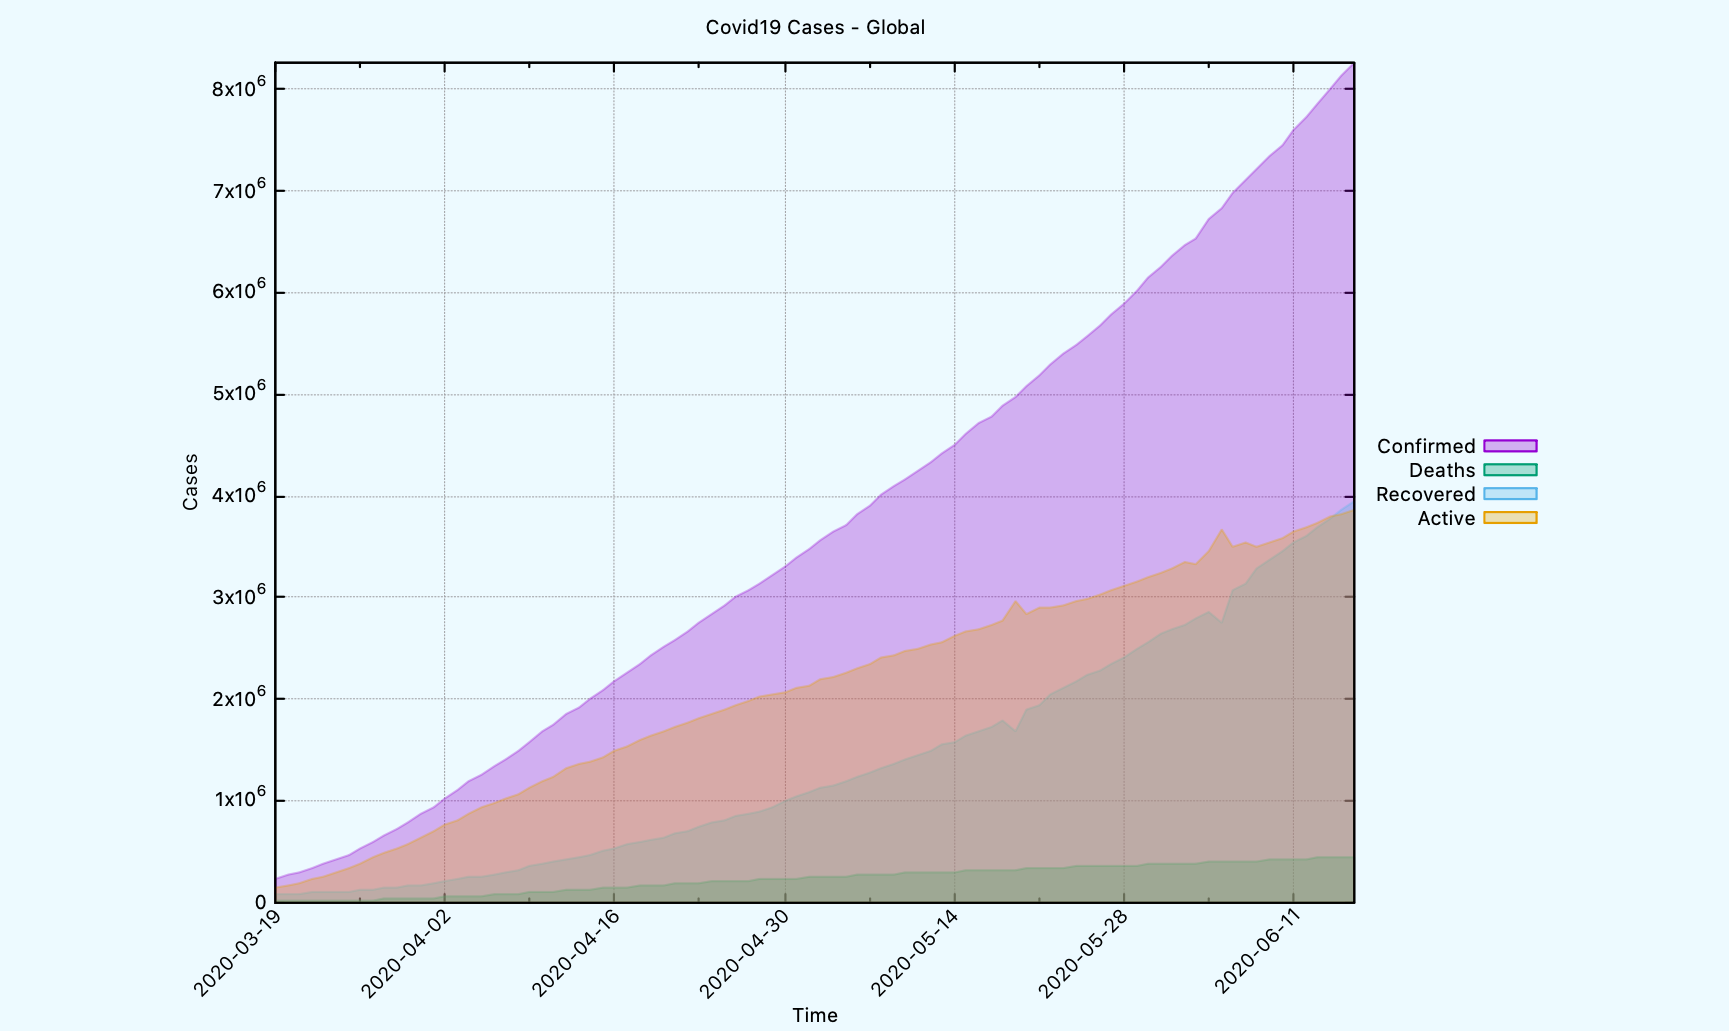
Another plot function that can be used is COVID19:PLOT-TIME-SERIES-GLOBAL.
CL-USER> (covid19:plot-time-series-global *db-conn* :limit 90)
NIL
The generated graph on a global scale looks like this.
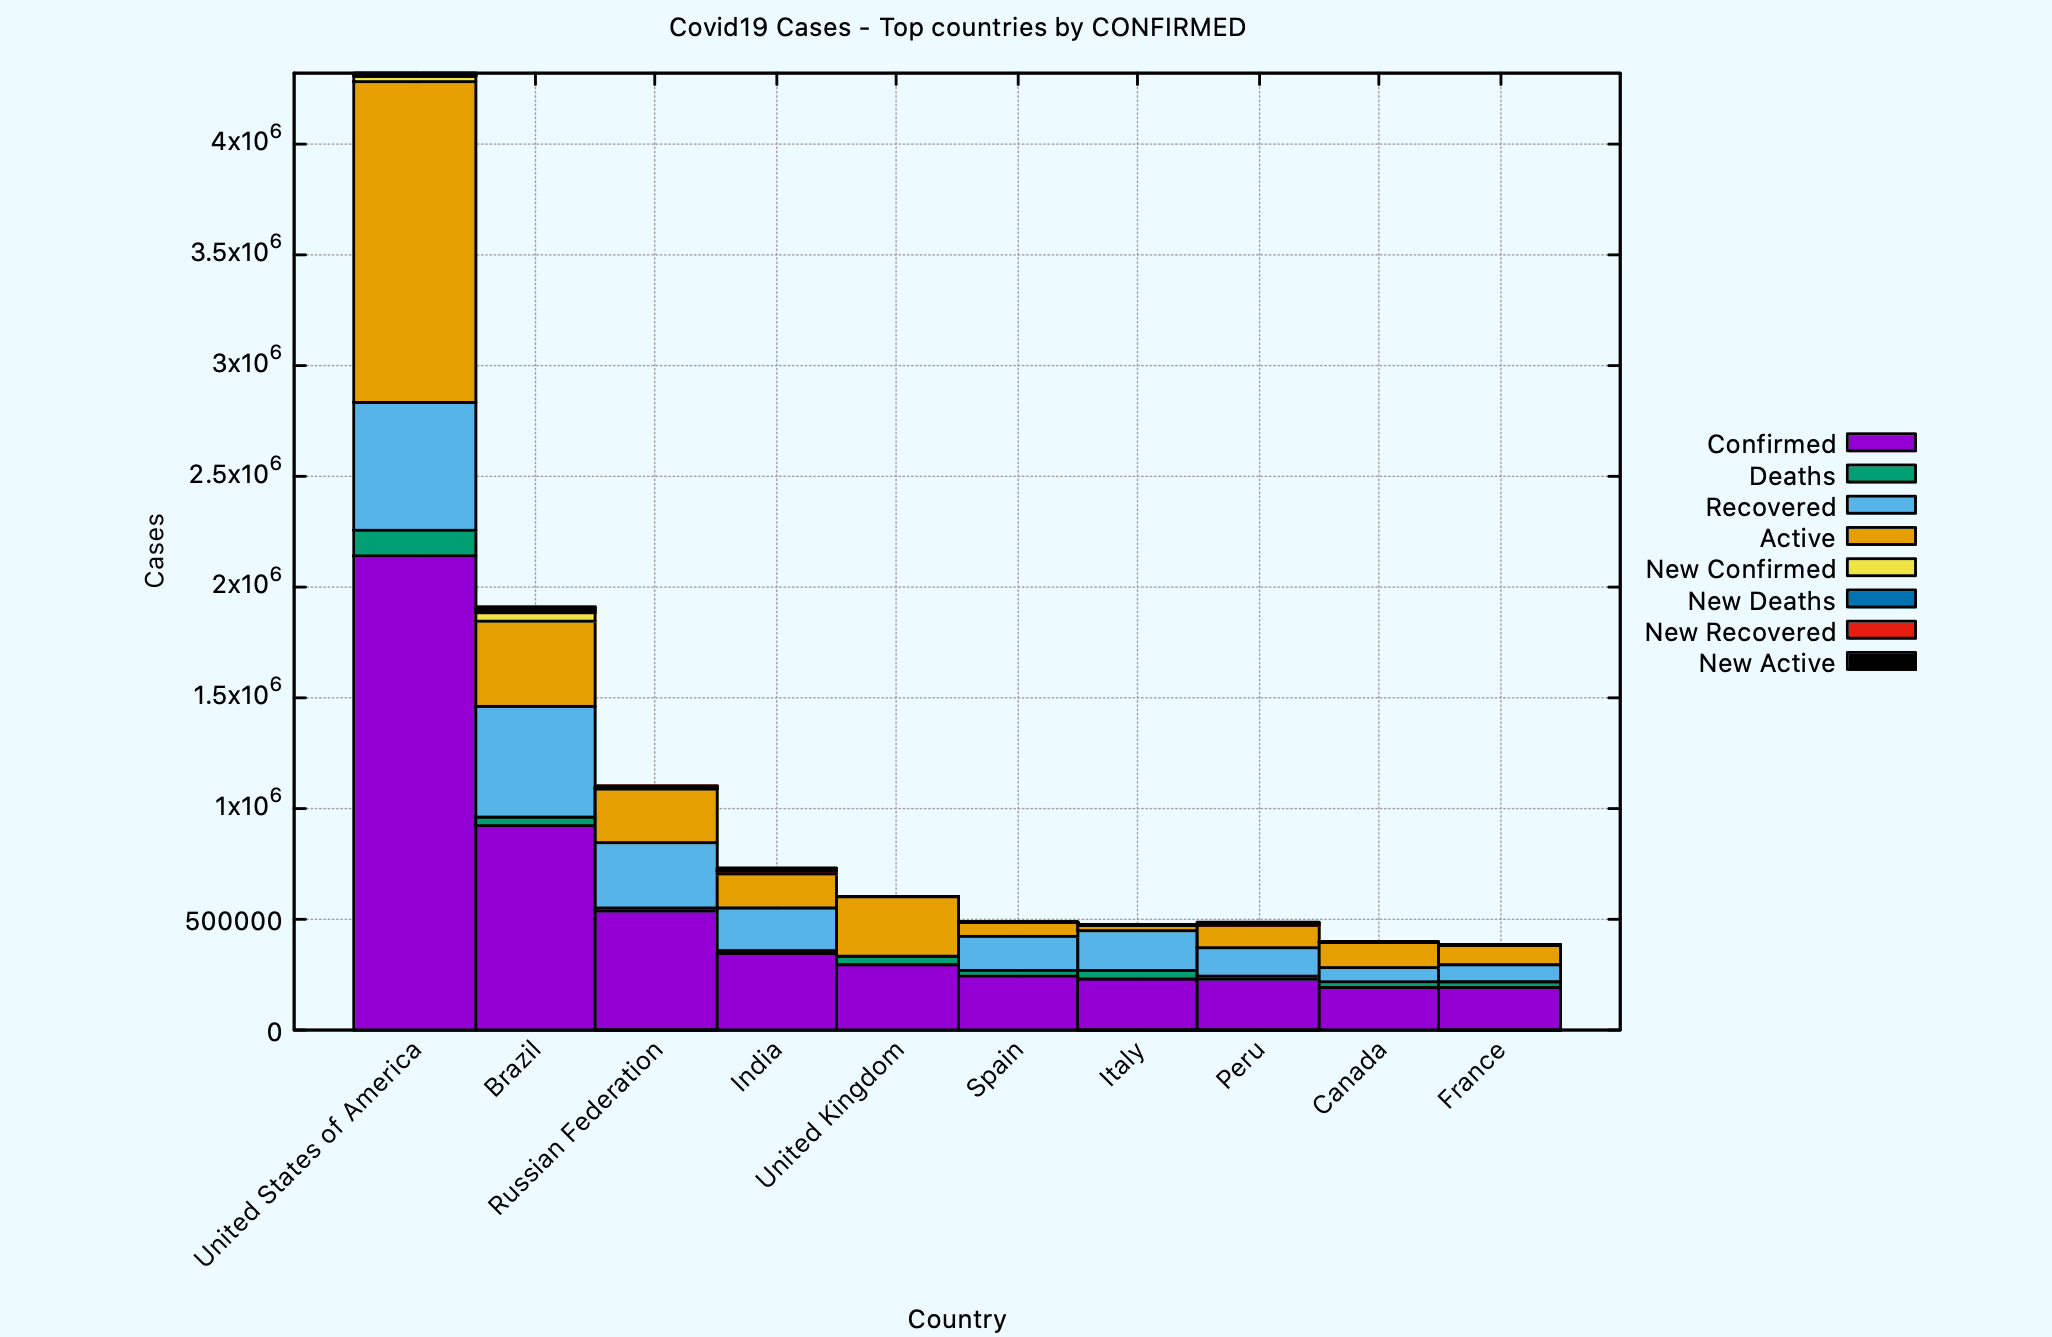
The COVID19:PLOT-TOP-COUNTRIES-BY function can be used to plot countries
by sorting them first on a given column. Here’s an example to plot a histogram
per each country based on the latest data using the confirmed column.
CL-USER> (covid19:plot-top-countries-by *db-conn* :column :confirmed :limit 10)
NIL
The generated graph looks like this.
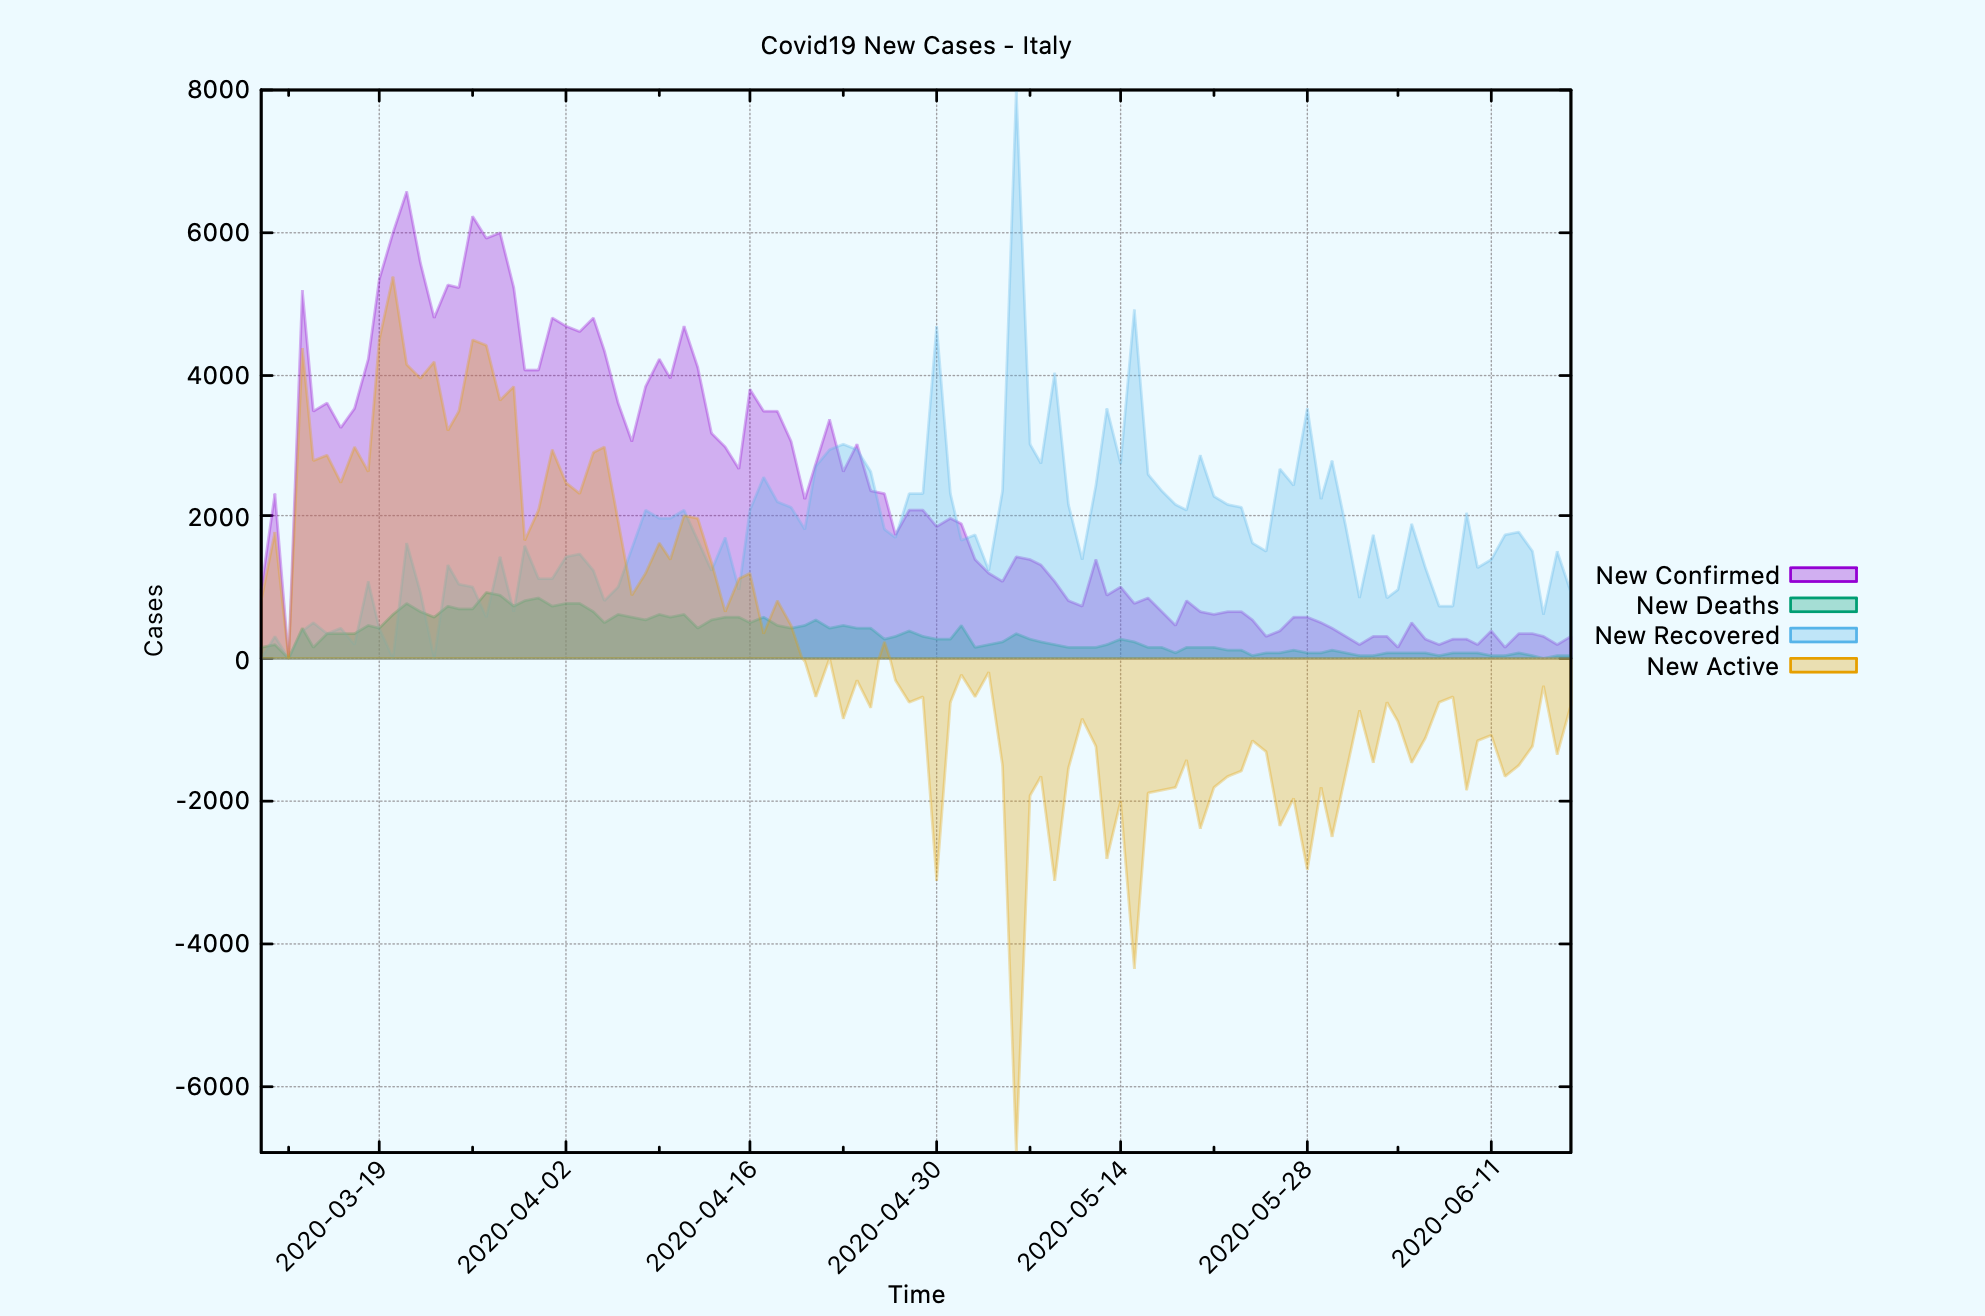
Another template that we can use to plot some graphs using the new
cases on daily basis is
COVID19:*GNUPLOT-TIME-SERIES-WITH-FILLED-CURVES-NEW-CASES-TEMPLATE*.
CL-USER> (covid19:plot-time-series-for-country *db-conn*
                                               "Italy"
                                               :limit 100
                                               :template covid19:*gnuplot-time-series-with-filled-curves-new-cases-template*)
NIL
The generated graph looks like this, which shows the new cases on daily basis.
For more examples, make sure to check the cl-covid19 repo.
Stay safe!