COVID-19 graph animations with gnuplot and Common Lisp
This is a follow up of a recent post about exploring COVID-19 data with Common Lisp.
A few additions made it into the cl-covid19 repo, and one of them is the ability to generate graph animations using the COVID-19 time series data with gnuplot, which is what this post is about.
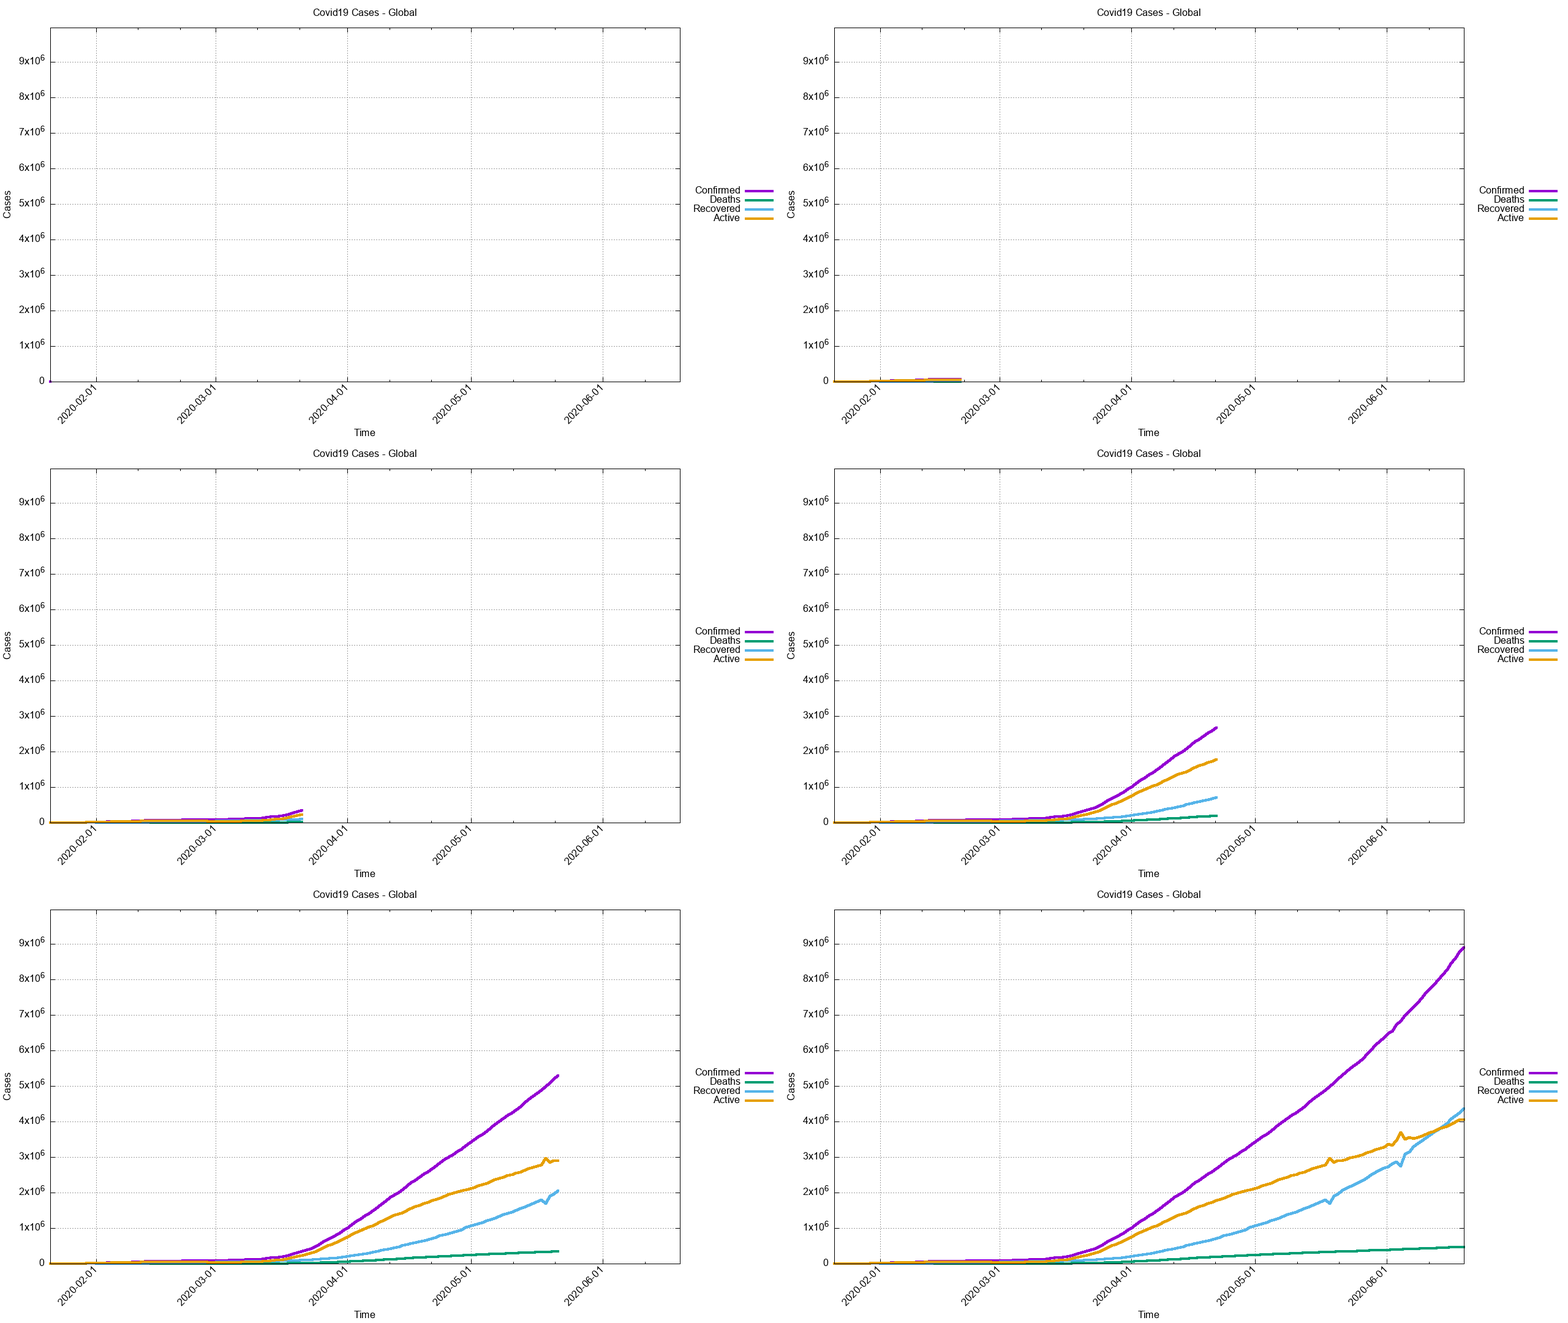
The COVID19:PLOT-TIME-SERIES-GLOBAL-ANIMATION function creates an
animation of the cases using the global time series data. When
creating an animation you need to specify the destination, where the
animation will be stored at. The :limit keyword parameter in the
example below specifies the number of time series records in ascending
order.
CL-USER> (covid19:plot-time-series-global-animation *db-conn*
                                                    #P"/tmp/covid19-global.gif"
                                                    :limit 200)
NIL
The generated animation looks like this.
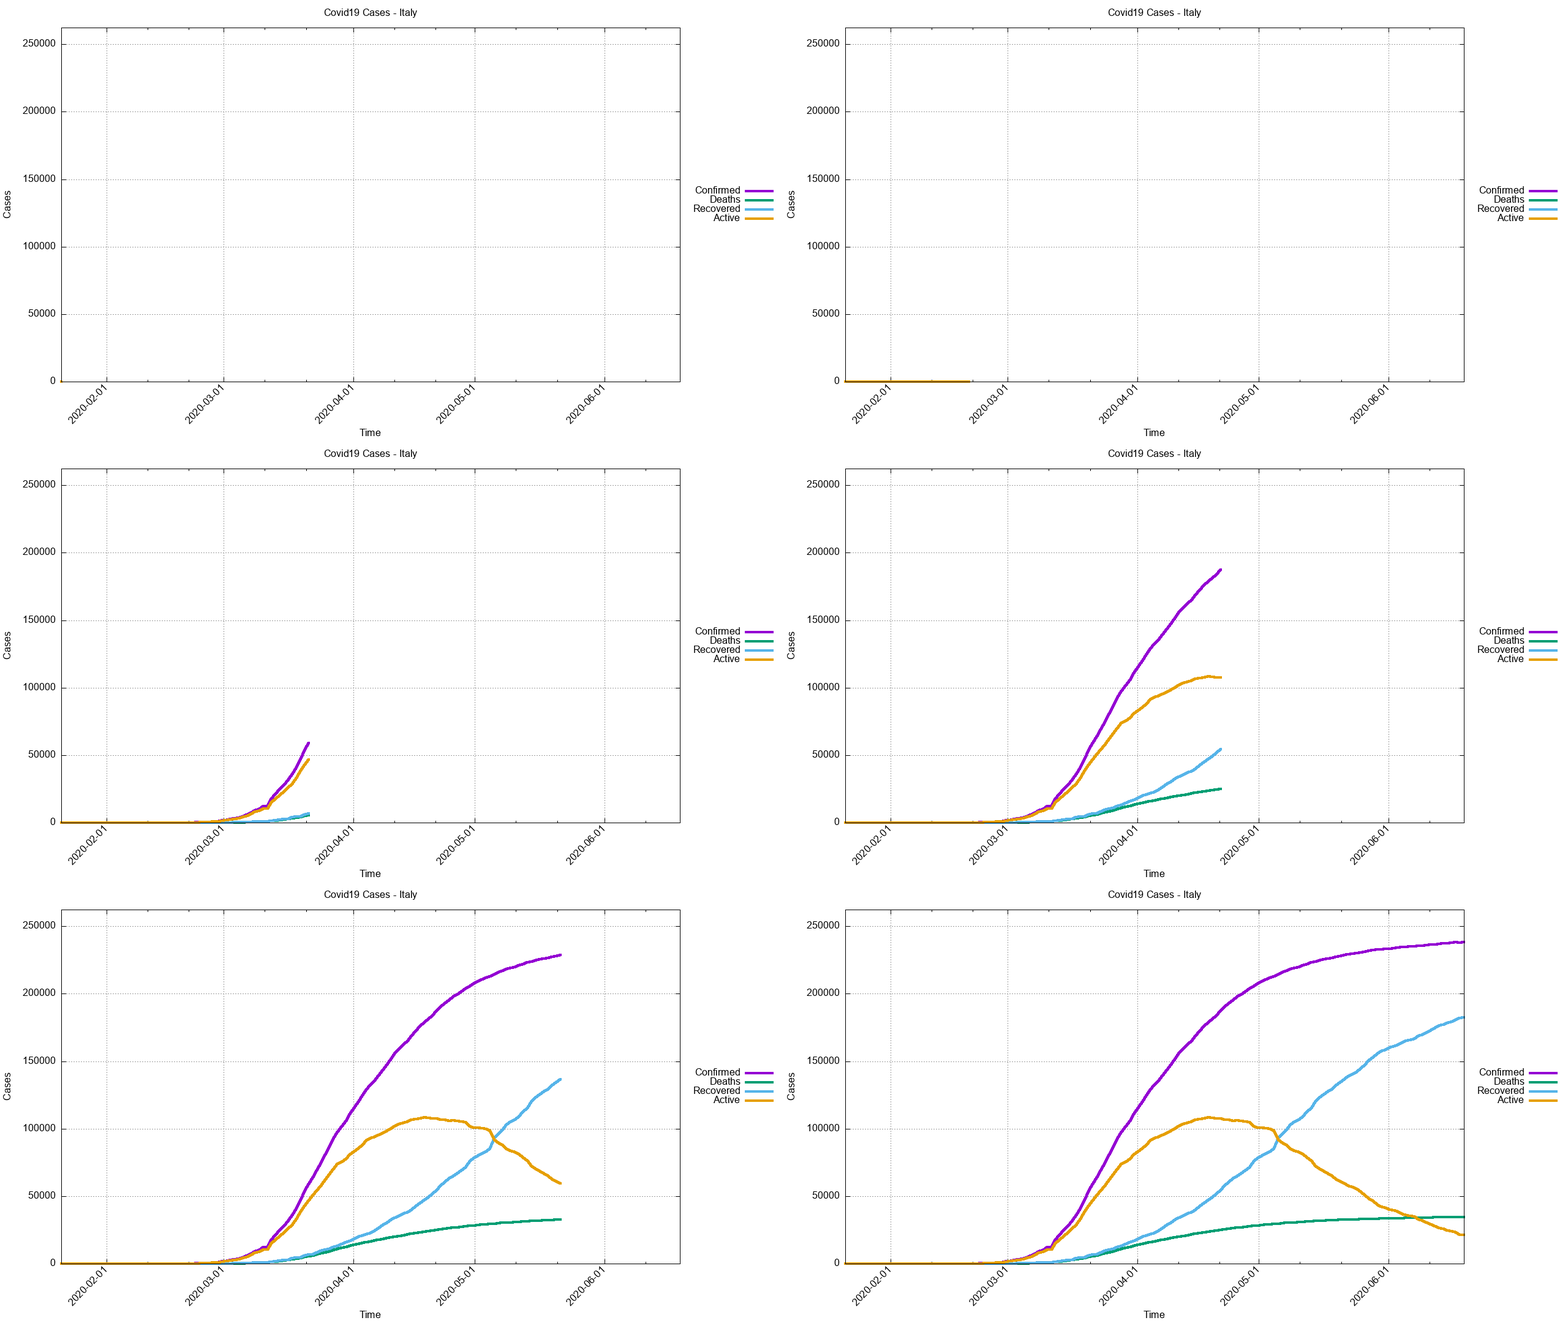
Another function, which creates animations from time-series data is
the COVID19:PLOT-TIME-SERIES-FOR-COUNTRY-ANIMATION. Here’s an
example.
CL-USER> (covid19:plot-time-series-for-country-animation *db-conn*
                                                         "Italy"
                                                         #P"/tmp/covid19-it.gif"
                                                         :limit 200)
NIL
The generated animation looks like this.
The :delay, :height, :width and :line-width keyword parameters
can be used to further customize the resulting animation.
You can find these and other gnuplot(1) plot templates in the
cl-covid19 repo.

