Monitoring the CPU temperature of your FreeBSD system in Zabbix
It is time again to add a few more metrics to be monitored on my FreeBSD systems and I thought I’d add monitoring of the CPU temperature this time.
In the past I had a system which was quite old and under a heavy load it used to burn the CPU and then go down. Now I want to be sure that this will never happen again and want to get some alerts whenever a system reaches a critical point.
So, in this post I’m going to show you how to get your CPU’s temperature monitored in Zabbix. The Operating System we use is FreeBSD 9.0 running on a Intel i5 CPU.
Okay, the first thing we are going to do is to prepare our FreeBSD system, so that we can gather some metrics from it, which we will later add to Zabbix.
Let’s load the coretemp(4) module:
$ sudo kldload coretemp
In order to load the coretemp(4) module during boot-time, you should add this line to your /boot/loader.conf file:
coretemp_load="YES"
You can check your CPU’s temperature by running a command like this:
$ sysctl -a | grep temperature
dev.cpu.0.temperature: 38.0C
dev.cpu.1.temperature: 39.0C
dev.cpu.2.temperature: 38.0C
dev.cpu.3.temperature: 39.0C
Okay, that’s good. Now we know how to get the CPU’s temperature, but it would be better if we could also get some nice graphs, isn’t it? Now is the time to play a bit with Zabbix. :)
First create a new template called Template App CPU Temp and a new application called CPU Temp Metrics.
For example on setting up a new template and application, if you haven’t done so already you can check the Monitoring PKGNG in Zabbix, Part I - Package Statistics post, which explains how to create an example template and application in Zabbix.
Once you’ve got your template and application it is time to create a new UserParameter in Zabbix.
Create a new file under /usr/local/etc/zabbix2/zabbix_agentd.conf.d/cpu_temp.conf (this assumes that your zabbix_agentd.conf file includes the /usr/local/etc/zabbix2/zabbix_agentd.conf.d/ directory). The contents of the cpu_temp.conf file are shown below:
UserParameter=cpu.temp[*],/usr/local/bin/cpu_temp.sh $1
Below you can find a simple shell script that takes care of getting the CPU temperature. The script will return the average CPU temperature of all cores, or the temperature of the core you specify it. So, now save this script in /usr/local/bin/cpu_temp.sh.
#!/usr/local/bin/bash

ncpu=$( sysctl hw.ncpu | awk '{ print $2 }' )

get_temp() {
	if [[ "$1" == "avg" ]]; then
		avg=0

		for c in `jot ${ncpu} 0`; do
			temp=$( sysctl dev.cpu.${c}.temperature | sed -e 's|.*: \([0-9.]*\)C|\1|' )
			avg=$( echo "${avg} + ${temp}" | bc )
		done

		avg=$( echo "${avg} / (${ncpu})" | bc )
		rc=${avg}
	else
		temp=$( sysctl dev.cpu.${1}.temperature | sed -e 's|.*: \([0-9.]*\)C|\1|' )
		rc=${temp}
	fi

	echo $rc
}

get_temp $1
exit 0
You can test that the script works by executing the script and passing it an argument avg or the CPU core you want to get the temperature of.
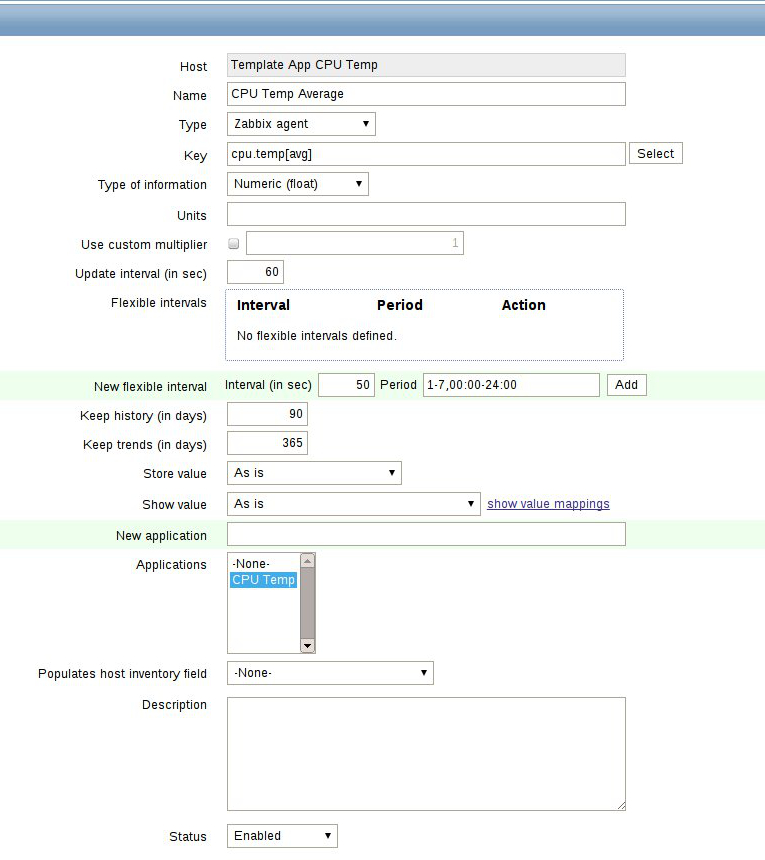
Now, it is time to add a few items in Zabbix. Navigate to the Items tab of your template and create a new Zabbix item for getting the average CPU temperature as shown on the screenshot below.
Lets create a graph of it as well, so navigate to the Graphs tab of your template and create a new graph for your new item you’ve just created. You could also create items for every core you have, that way you can monitor the temperature of each core by creating an item with a key like cpu.temp[0], which will give you the temperature of the first core.
Once ready attach the template to your systems and start monitoring your CPU’s temperature. Below you can find a few example screenshots on one of my systems.
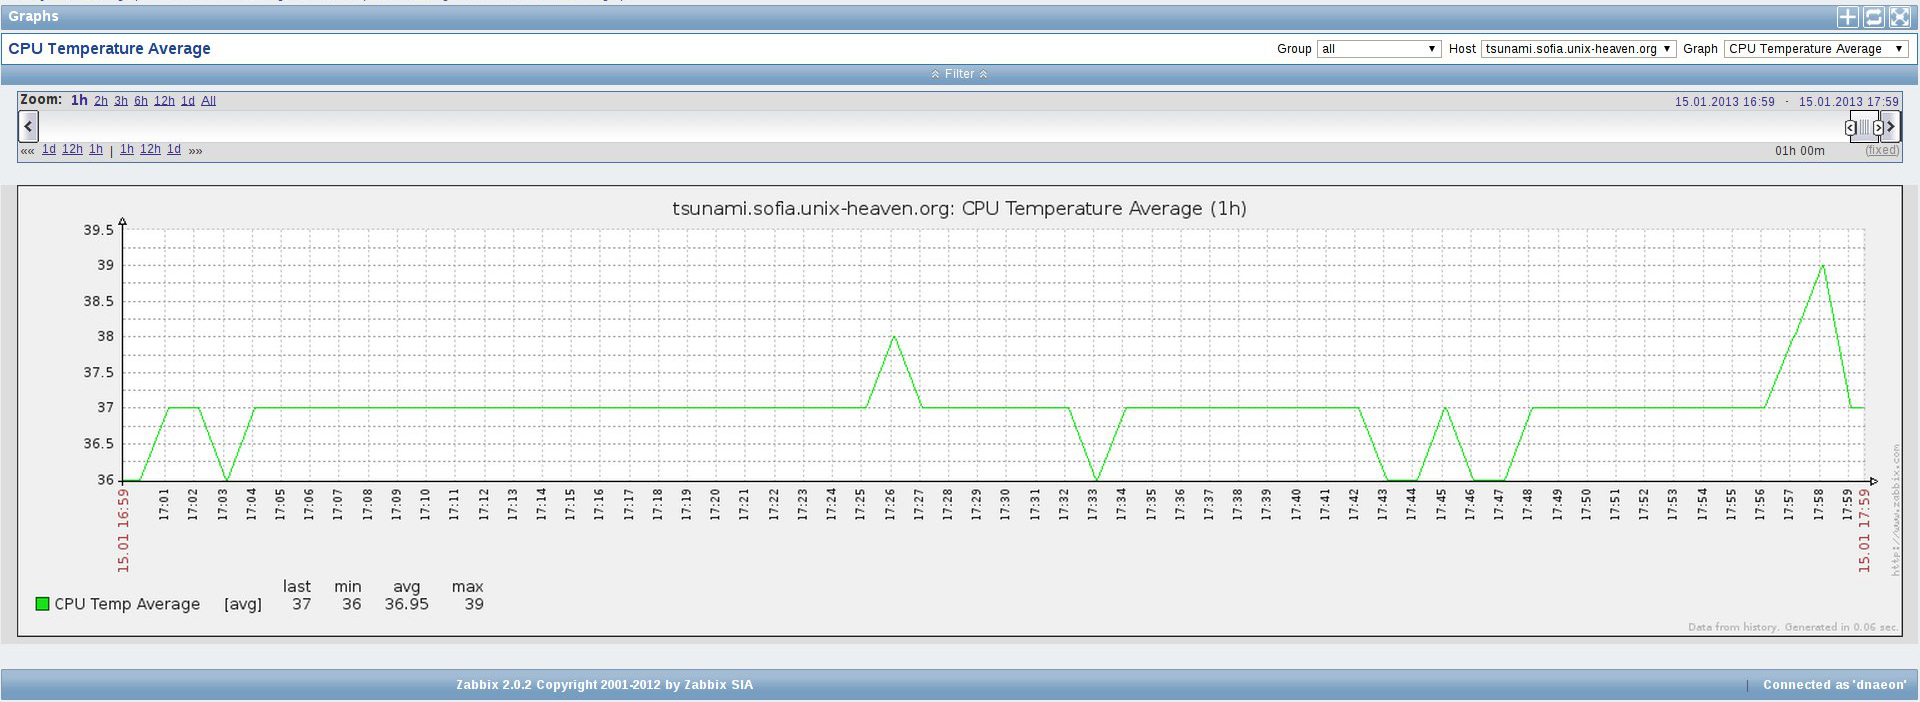
Here’s how graph of the average CPU temperature looks like:
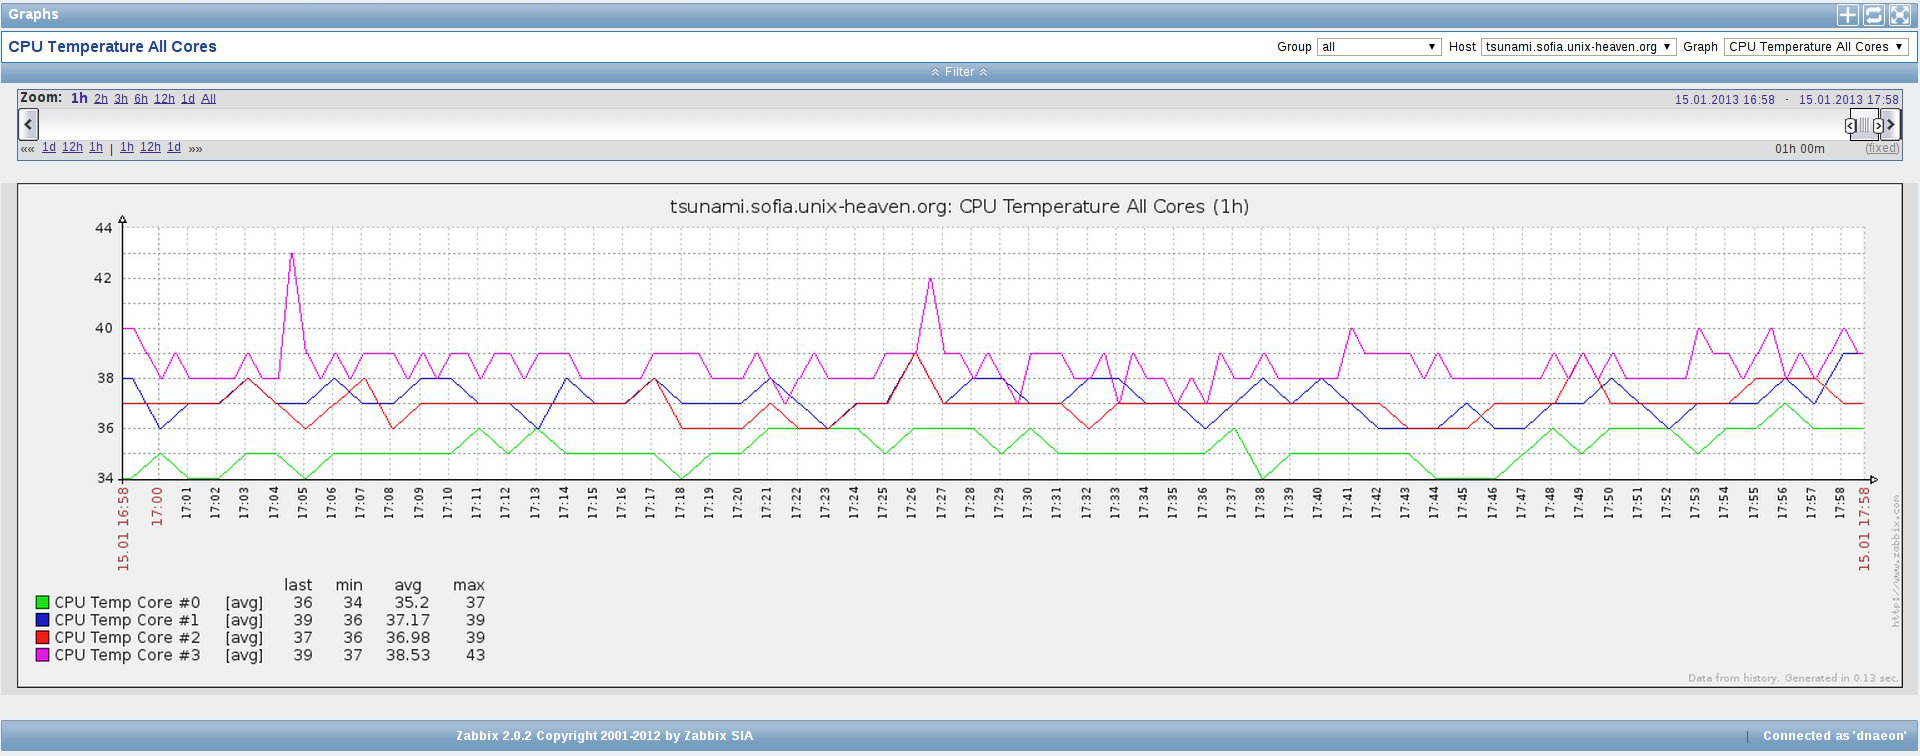
And this is how the graph of the CPU temperature for all cores looks like: